(Code) Portfolio
From A to B with RL
In this project done with Charlie Sempé, Ralph el Hage and Manuel Cornu we have tried to implement and tweak a few Reinforcement Learning algorithms, viz. Deep-Q Networks (DQN), Advantage Actor Critic (A2C) and Proximal Policy Optimization (PPO) models using Pytorch. We have used them to solve the Frozen Lake, Car Racing and Mountain Car (continuous) environments from Gymnasium.
- Modified the agent observation in Frozen Lake (adjacent tiles) and Car Racing (image stacking)
- Designed custom (harder) levels in Frozen Lake and modified rewards to improve our DQNs
- Wondered why our A2C models worked so poorly for Car Racing … 😅


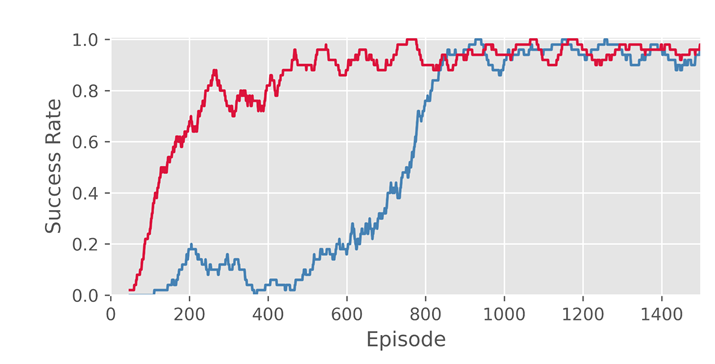
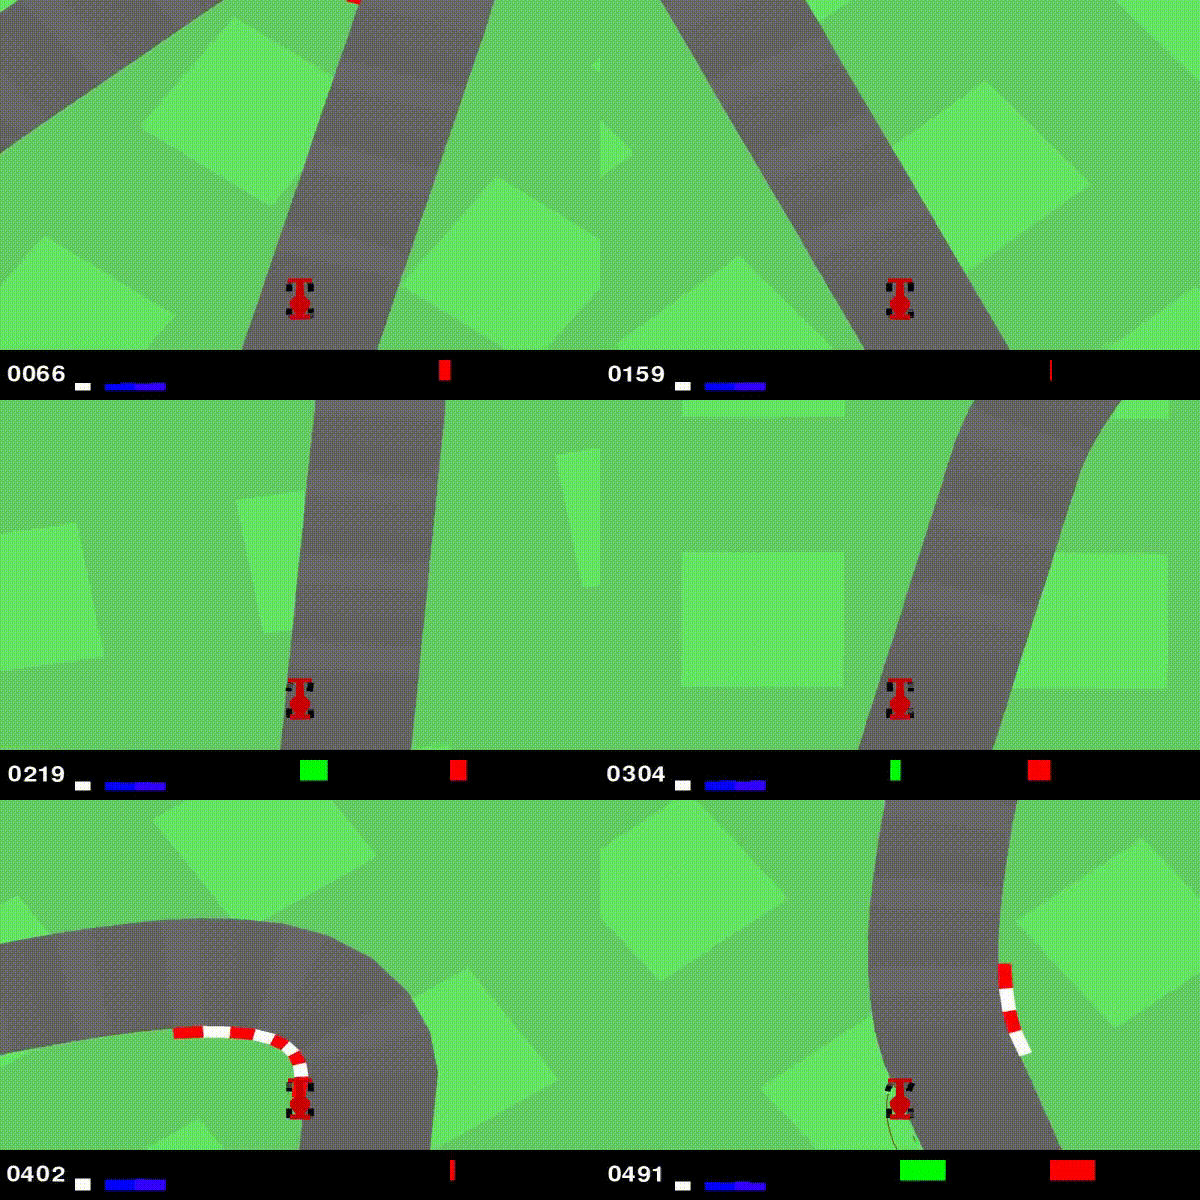
Left : Success rate of the Frozen Lake agent when they only know their position (blue curve) and when they know the type of the adjacent tiles (red). Right : our wonderful self-driving car obtained combining Convolutional Neural Networks (CNN) and DQN
This is still a work in progress, we eventually hope to train Doom or Super Mario agents !
Read-Rheol
This project was borne out of frustration from having to work with rheometer software. They are usually very clunky and inefficient for researchers, so I want to get a .csv-like file as fast as I can and transform it into a Pandas DataFrame to toy around. I wrote a few templates and templates to export your rheology data into .txt files, and I then wrote a ‘universal’ reader for files exported from Rheology software, so far for Anton Paar (RheoCompass), TA Instruments (Rheology Advantage and Trios) or Malvern Panalytical (rSpace). So normally you should be able to feed the programme their text files and eventually obtain a properly formatted DataFrame. Rheologists also usually plot the same things over and over again, their flow curves, their oscillatory amplitude sweeps, etc. so I have coded shorthands to quickly plot them in an orderly fashion.

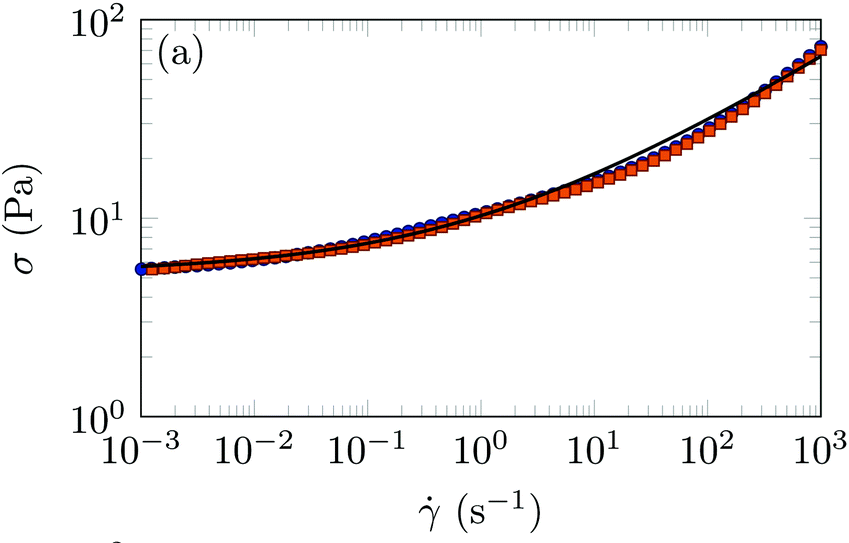
A typical plot done in rheology, a flow curve relating the shear stress (the ‘force’) and the shear rate (the ‘deformation’ rate) in a pasty medium.
Python-Zero
In my work at Laboratoire Navier, I was regularly approached to give a hand on existing bits of code or think about giving Python classes to an engineering doctoral school ; they have specific needs in terms of code (solving differential equations or signal processing with Scipy, image processing with Scikit-image, …), in particular Soft Matter students who need to track particles, bubbles, … So I worked on designing interactive, Jupyter-based tutorials (in French) to teach ‘classic’ Scientific Python from scratch aimed at engineering students, along with exercises, and with the initial idea that I would guide students throughout their progress during classes. I eventually did not teach these classes due to a conflict in my schedule, but I left the tutorials open and available to everyone in the lab.
Advanced use of Matplotlib to make animated plots is included in the tutorials …

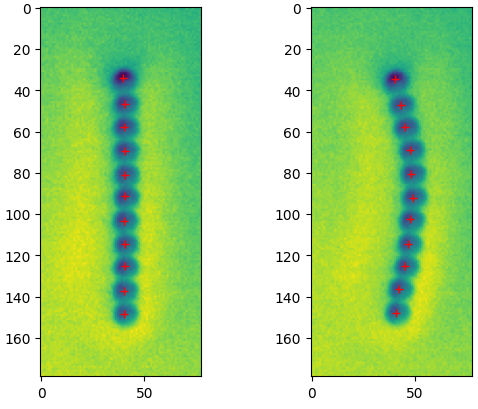
Detection of particles by their centers (crosses) using tracking using Trackpy is also included. Pictures of beams of colloidal particles of around 2um in diameter courtesy of Julie Goyon, Xavier Chateau and Anaël Lemaître.